
I was recently working on my second Grafana plugin, this time containing a backend plugin. In that process, I was running into quite some challenges - mostly caused by myself not being a very good Go developer.
As I disliked debugging via logging to stdout already in good old PHP times (where the time to compile was zero), I wanted to have a proper debugger (apparently Delve) connected via IntelliJ. If you use Goland, I expect everything to be exactly the same.
While Grafana’s create-plugin tool is results in a fantastic developer experience and also, theoretically, generates everything which is needed to attach a debugger, this failed for me on MacOS using Apple Silicon (ARM64, darwinARM64).
If you don’t want to read through my lengthy monologue of things that did not work, you can directly jump to the section Worked for me - or to What probably also works (and might be easier).
Did not work: Debugging in Docker
The plugin scaffolding already generates a docker-compose.yaml file, which will be used when calling npm run server. This was very comfortable while trial and error'ing the initial development phase.
How to run Delve in Docker for Grafana plugin development is described in this post. For this to work, one would first build the plugin with debug symbols (mage build:debug) and then kill the gpx_my_plugin_name_linux_amd64 process, after which Grafana would restart the plugin.
Unfortunately, attaching the debugger failed for me with the following error message:
root@81c9000cfe18:/plugin# dlv attach --headless --listen=:2345 PID
API server listening at: [::]:2345
2023-10-31T19:51:03Z warning layer=rpc Listening for remote connections (connections are not authenticated nor encrypted)
Warning: no debug info found, some functionality will be missing such as stack traces and variable evaluation.
could not attach to pid 3511: could not read debug info (decoding dwarf section info at offset 0x0: too short) and could not read go symbol table (could not read section .gopclntab)
I’m not sure, where this is coming from. I have the assumption it is a limitation of the tool I use to run containers on my Mac (OrbStack), which is in general pretty cool, but I also ran into problems playing with eBPF programs. So it might be that despite having capability SYS_PTRACE, the dlv is not allowed to trace the process. If you use another tool (Docker Desktop, Rancher, etc.), maybe it works for you.
Did not work: Running Grafana on MacOS
As next step, I downloaded Grafana for Mac from their download page. It can be started using bin/grafana server.
After symlinking my plugin’s dist/ folder into a subfolder of data/plugins/ (don’t put the gpx_* files directly into data/plugins/, your plugin will not be discovered), I was happy to see my plugin being loaded.
However, at the time of writing (Grafana version 10.2.0), there is still no ARM64 build available. While this appears reasonable (who wants to run Grafana on a Mac!), this makes it complicated for developing on a Mac. Luckily, around that time, I discovered that parts of what had to be done manually before are actually covered in a target
$ mage debugger
This step is inherited from grafana-plugin-sdk-go.
Other available targets are:
$ mage -l
Targets:
  build:backend                 build a production build for the current platform
  build:darwin                  builds the back-end plugin for OSX.
  build:darwinARM64             builds the back-end plugin for OSX on ARM (M1).
  build:debug                   builds the debug version for the current platform
  build:generateManifestFile    generates a manifest file for plugin submissions
  build:linux                   builds the back-end plugin for Linux.
  build:linuxARM                builds the back-end plugin for Linux on ARM.
  build:linuxARM64              builds the back-end plugin for Linux on ARM64.
  build:windows                 builds the back-end plugin for Windows.
  buildAll*                     builds production executables for all supported platforms.
  clean                         cleans build artifacts, by deleting the dist directory.
  coverage                      runs backend tests and makes a coverage report.
  debugger                      makes a new debug build, re-launches the plugin and attaches the Delve debugger, in headless mode listening on port 3222.
  e2E:append                    starts the E2E proxy in append mode.
  e2E:certificate               prints the CA certificate to stdout.
  e2E:overwrite                 starts the E2E proxy in overwrite mode.
  e2E:replay                    starts the E2E proxy in replay mode.
  format                        formats the sources.
  lint                          audits the source style
  reloadPlugin                  - kills any running instances and waits for grafana to reload the plugin
  test                          runs backend tests.
  watch                         rebuilds the plugin backend when files change.

* default target
However, having Grafana built for Intel CPUs (AMD64) running, this also loaded the darwin_amd64 build of the plugin. In contrast, the make build:debug (which is automatically invoked by the debugger target) is only creating a debug build for the current platform. My Mac’s current platform is ARM64, not AMD64!
While I’m sure there is a way to fix this, I moved on to whatever next came to my mind…
Worked for me: Building Grafana
While no download was available, I was optimistic to get Grafana built myself. As usual for the Grafana community, building it is very well described in the Developer Guide. After building the frontend with YARN, the server can be started using
$ make run
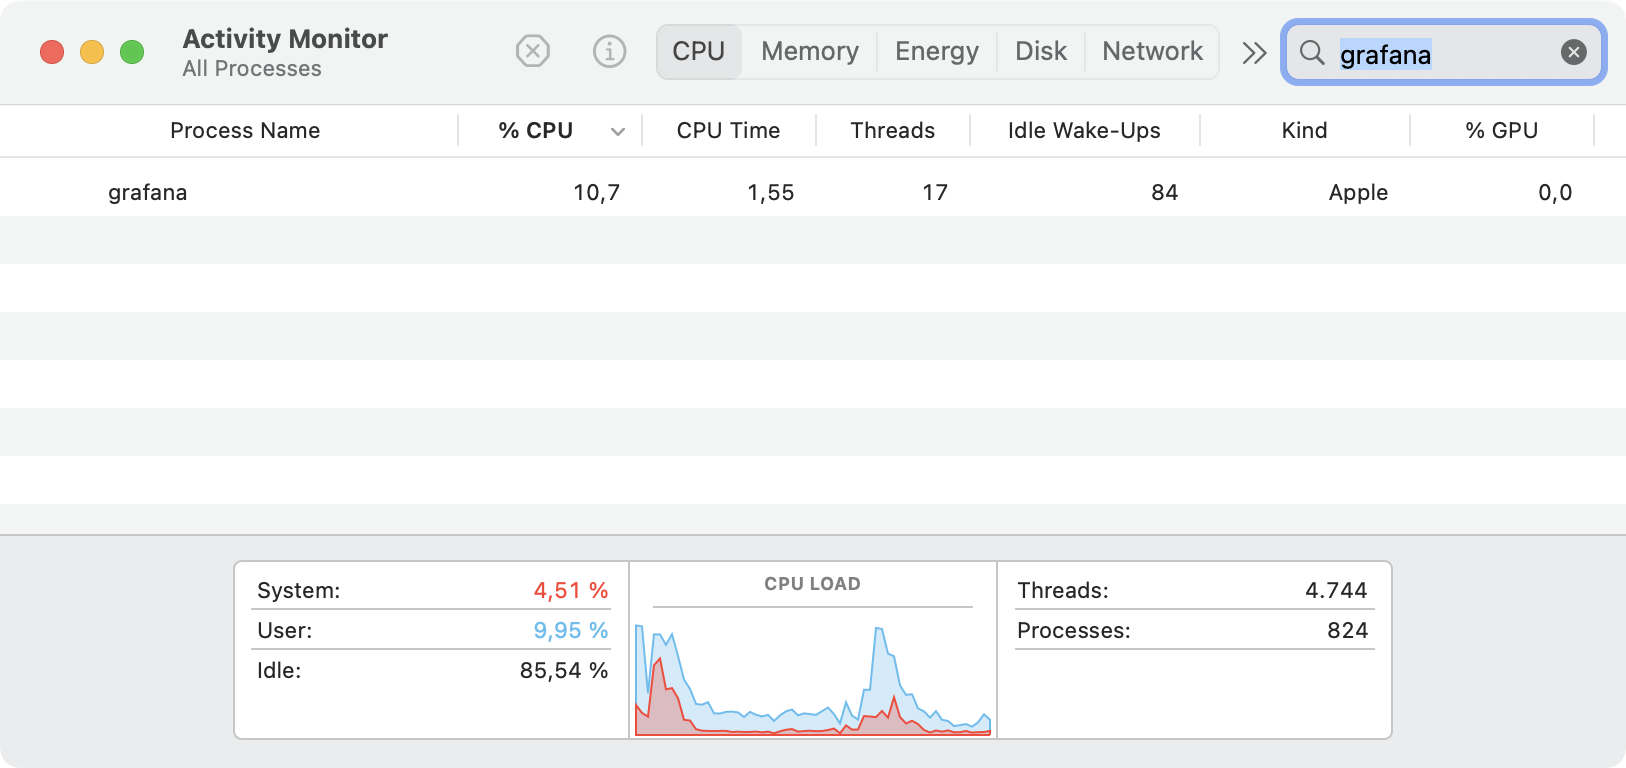
You can now see in the Activity Monitor that grafana runs as Kind Apple, where in contrast it was before Intel:
To allow unsigned plugins to be executed, follow the documentation and update conf/defaults.ini to
app_mode = development
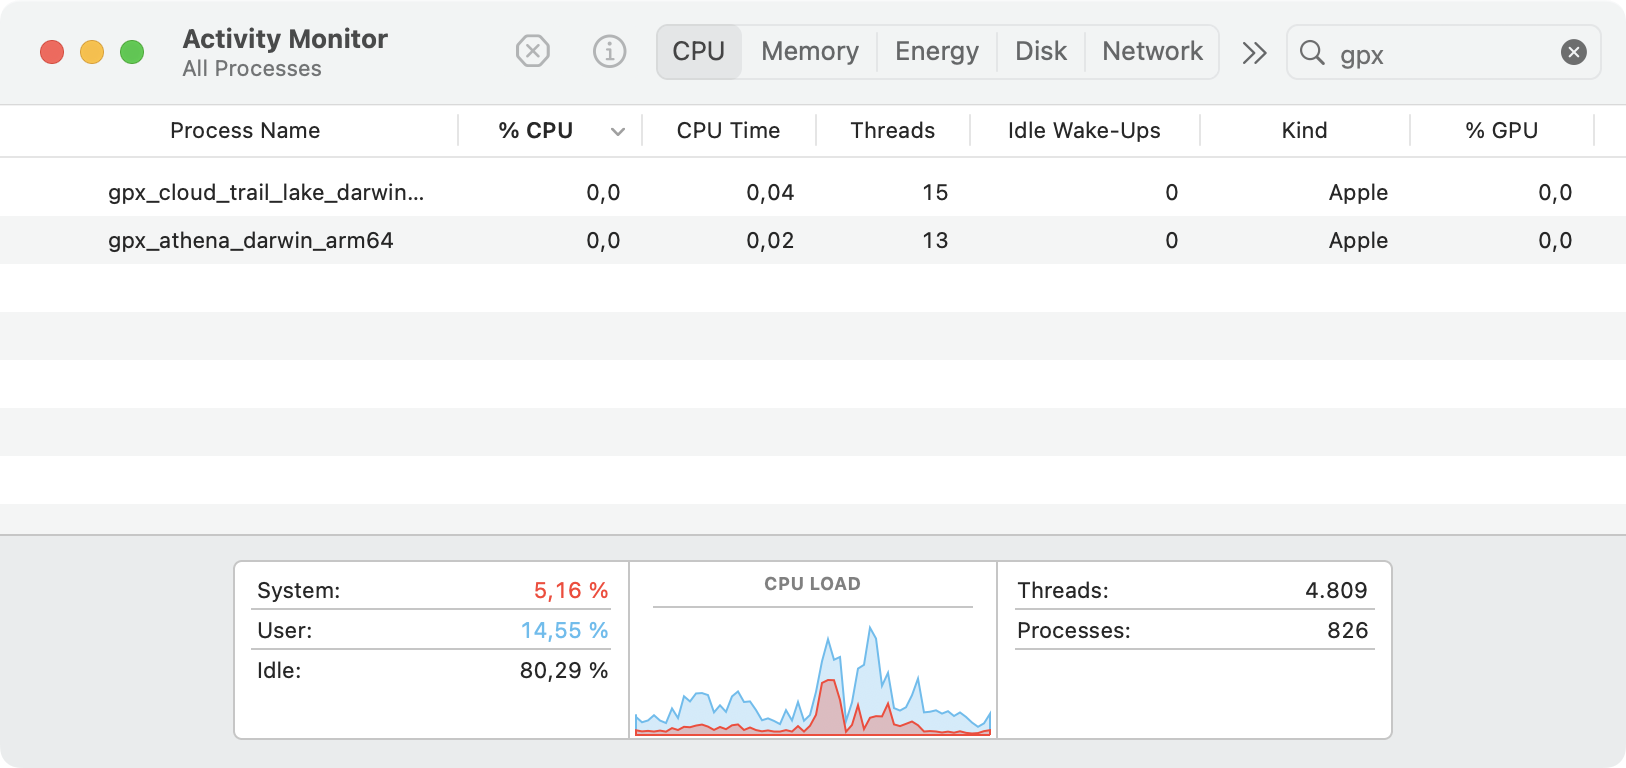
After installing my plugin in Grafana, it is also shown as Apple and also with the *_darwin_arm64 file name.
If the plugin is not shown in Grafana, make sure the folder structure is correct, which you can easily check by installing another plugin for comparison.
While you have Grafana running (via above make run), execute in your plugin’s folder:
$ mage debugger
You will first see Grafana complaining that the plugin process exited (it will immediately restart it):
ERROR[10-31|21:31:00] plugin process exited logger=plugin.foobar-something-datasource path=/Users/.../foobar-something-datasource/dist/gpx_some_thing_darwin_arm64 pid=23337 error="signal: killed"
while your other console will (hopefully!) report success:
mage debugger
API server listening at: [::]:3222
2023-10-31T21:31:01+01:00 warning layer=rpc Listening for remote connections (connections are not authenticated nor encrypted)
2023-10-31T21:31:01+01:00 info layer=debugger attaching to pid 23517
2023-10-31T21:31:01+01:00 debug layer=debugger entryPoint 0x1044bc000 machoOff 0x100000000
2023-10-31T21:31:01+01:00 warning layer=debugger debug_frame workaround not applied: function internal/abi.(*RegArgs).Dump (at 0x1044bd070) covered by 0x1044bd070-0x1044bd240
2023-10-31T21:31:01+01:00 debug layer=debugger Adding target 23517 ""
Now, we need to connect IntellJ / Goland to the remote debugger. If you use VSCode as IDE, then please consult the Internet on how to connect to dlv, as the remaining steps will be different.
Under Run > Edit Configurations..., add a new Go Remote configuration for port 3222:
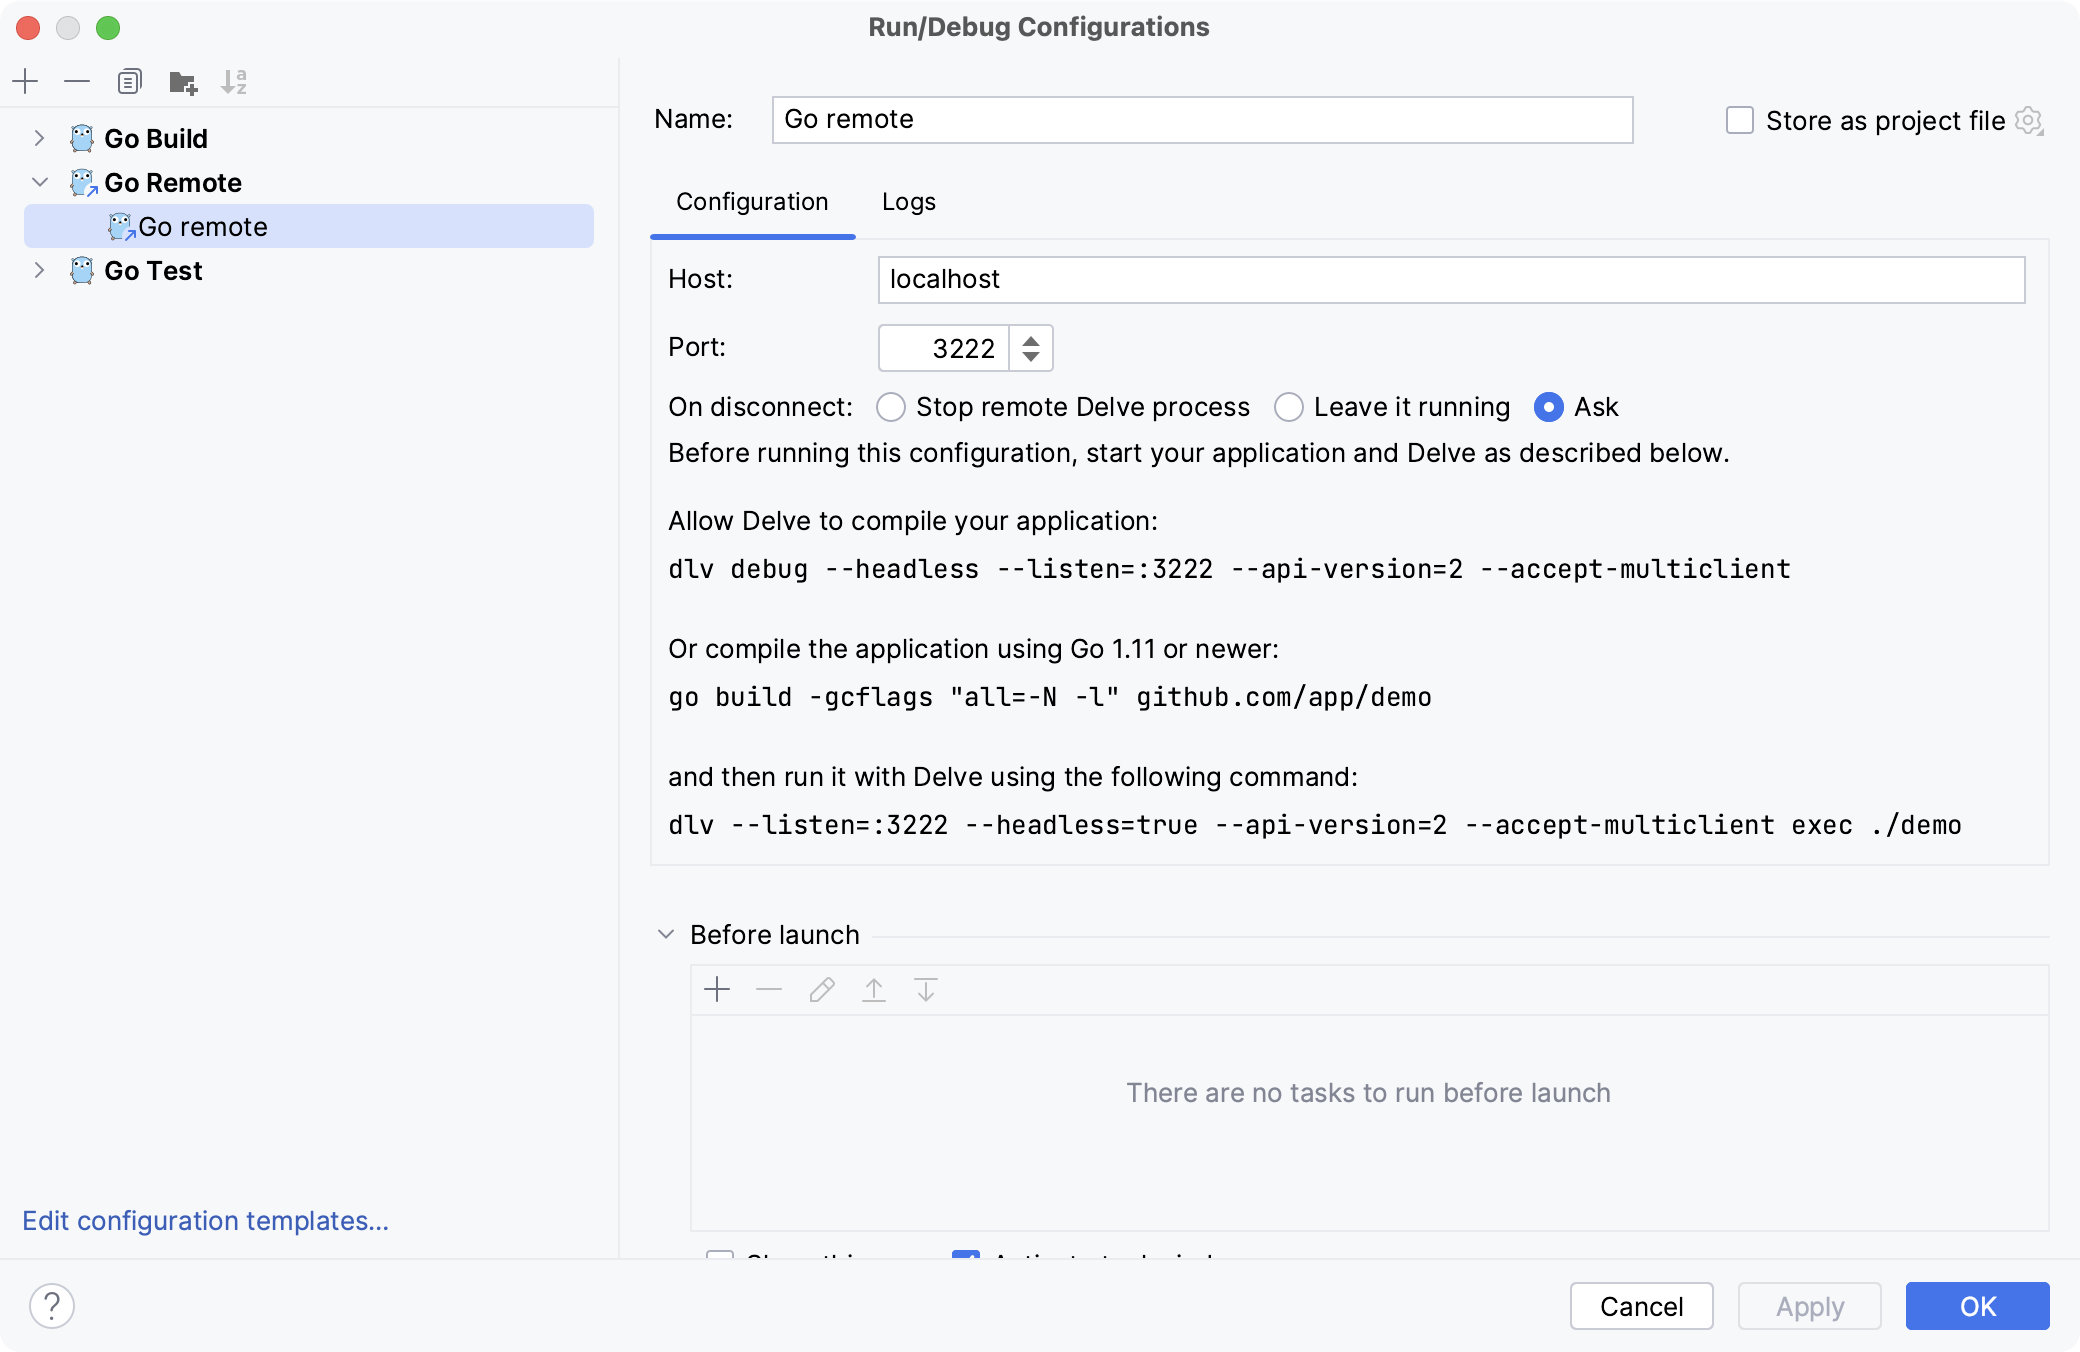 .
.
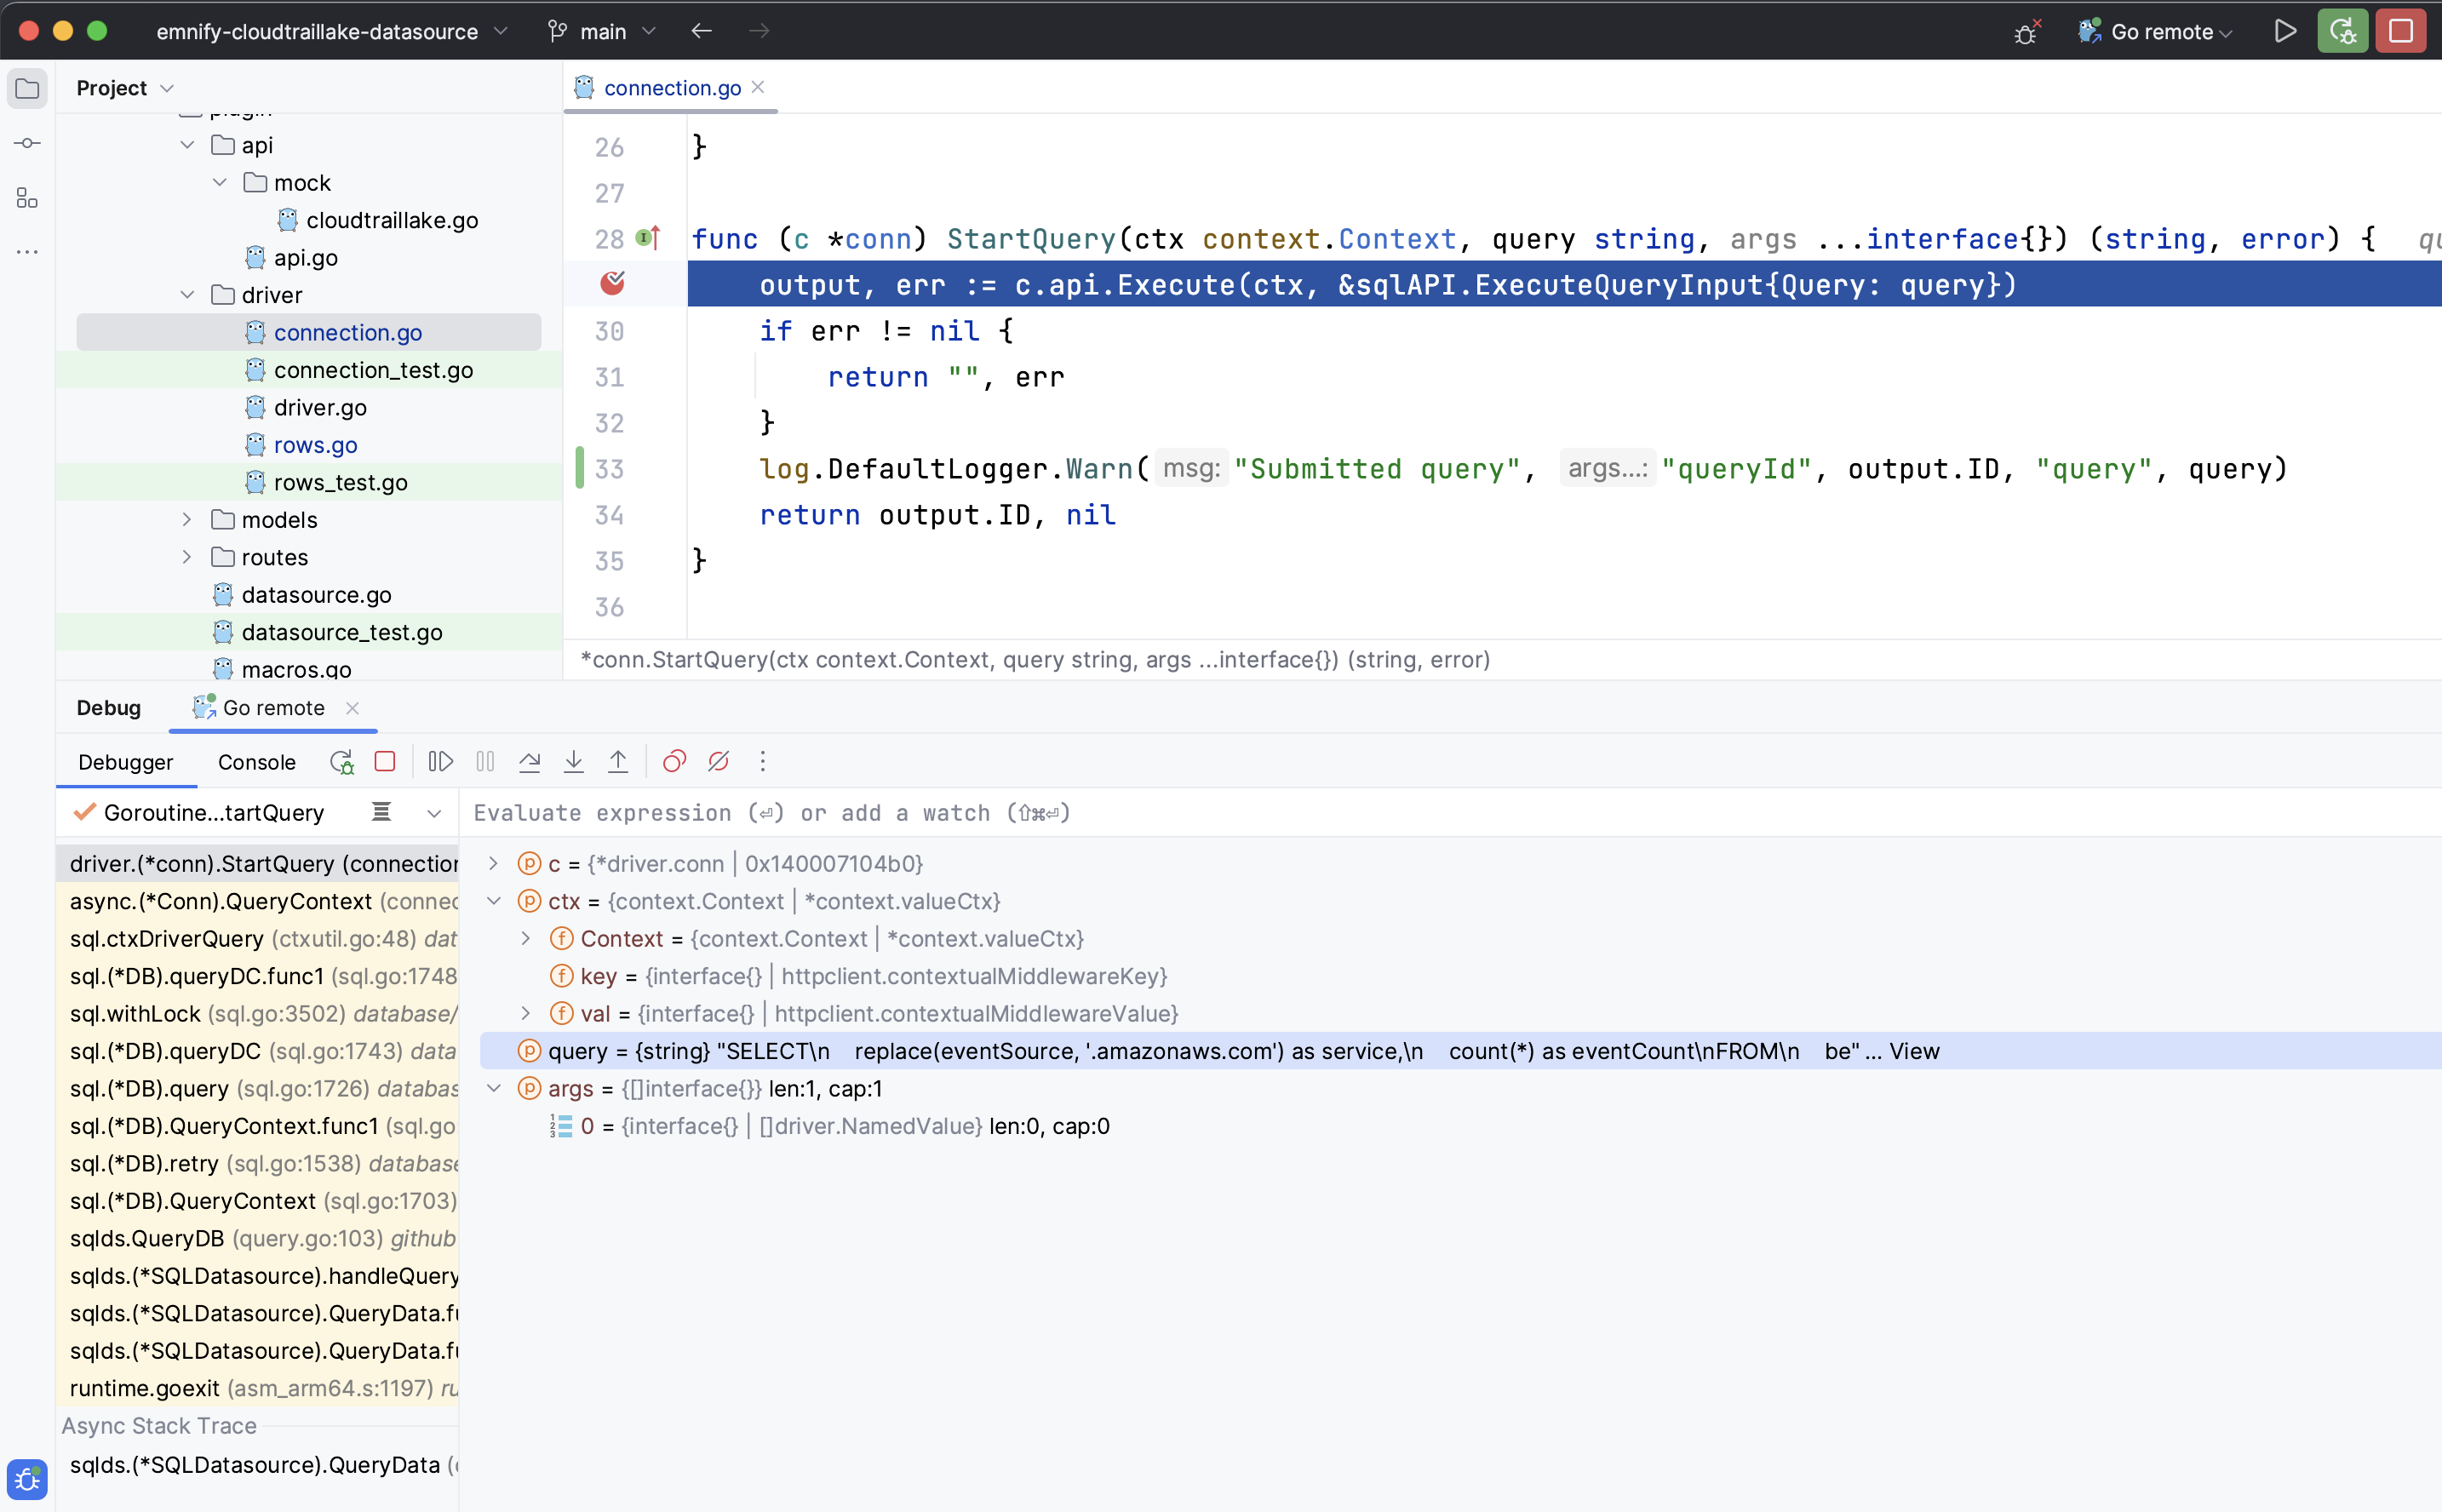
Pick a line in your code and place a breakpoint and start the debugger using the bug icon on the upper right.
 .
.
Depending on where in your code you placed the breakpoint, you might have to execute a query.
I hope this helps you with developing your plugin. In case you have any corrections to this article, you’re welcome to contact me via @StGebert@digitalcourage.social.
Happy debugging!
Update: What probably also works: Homebrew
After posting about this article [in the Grafana community](https://community.grafana.com/t/plugin-debugging-on-macos-apple-silicon/106799/, I got the feedback that installing it via homebrew would also provide an ARM64 Grafana.
Indeed, this is true:
$ brew install grafana

==> Downloading https://ghcr.io/v2/homebrew/core/grafana/manifests/10.1.1
#################################################################################################################################################################################################### 100.0%
==> Fetching grafana
==> Downloading https://ghcr.io/v2/homebrew/core/grafana/blobs/sha256:31f547ed00edb1ac7b60a764fee642f70c1eecb811400974f266861a8efba094
#################################################################################################################################################################################################### 100.0%
==> Pouring grafana--10.1.1.arm64_ventura.bottle.tar.gz
==> Caveats
To start grafana now and restart at login:
  brew services start grafana
Or, if you don't want/need a background service you can just run:
  /opt/homebrew/opt/grafana/bin/grafana server --config /opt/homebrew/etc/grafana/grafana.ini --homepath /opt/homebrew/opt/grafana/share/grafana --packaging\=brew cfg:default.paths.logs\=/opt/homebrew/var/log/grafana cfg:default.paths.data\=/opt/homebrew/var/lib/grafana cfg:default.paths.plugins\=/opt/homebrew/var/lib/grafana/plugins
Especially the last command is nice, because I usually struggle to find around where homebrew has put the config files.